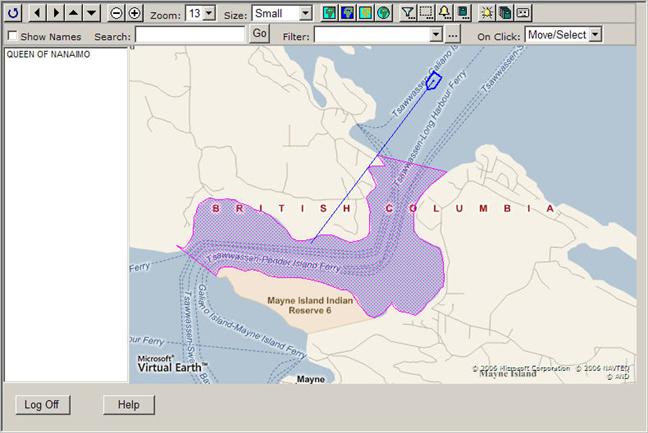
If you need to make the thorough analysis of the speed of the vessels within any particular busy passage, you can use this report.
Note: To produce this report we have built the “Active Pass” zone (the magenta polygon).
Active Pass is on the main connecting ferry route between the mainland and Vancouver Island.
Creating the Speed Summary report:
Click  to open the Report Designer panel.
Click the Select Report dropdown box and select <New>.
Instead of “Report1” type “Active Pass Speed Summary” in the Report Name field.
Leave Enable checked.
Select “Speed Summary” from Report Type.
Select “Active Pass” Zone.
Leave Filter blank.
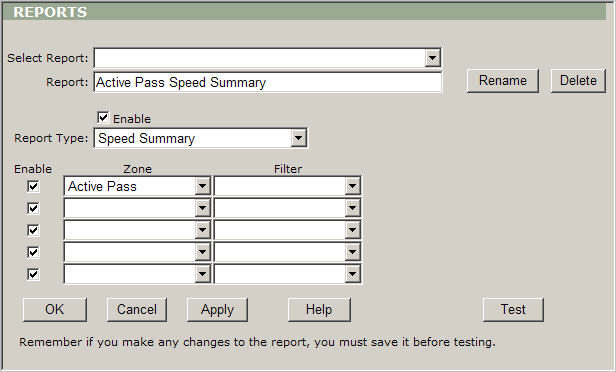
Click Apply to save the settings.
Click Test to display the report.
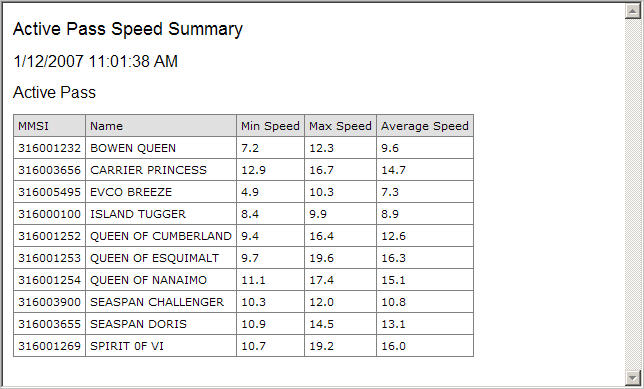
Note: The report displays the information for the last 24 hours. The 24 hours is the default value.